
Analytics data stack
Use case
A media organisations relied on manual reporting: analysts produced Excel and PowerPoint packs, distributed them by email, and then repeated the same work every cycle. Data was fragmented across digital and commercial platforms (web analytics, video, subscriptions, notifications, social, ad tech) and was only occasionally joined to finance data, making it difficult to produce consistent, context-rich insights.
The organisations needed an analytics capability that scaled across teams and functions, supported near real-time reporting where required, and reduced dependency on a small central team. A key requirement was self-serve: users should be able to explore and analyse trusted data directly in Power BI, and—where appropriate—through Excel connections to a governed semantic layer.
Approach
We started by defining a “single source of truth” operating model: consistent metric definitions, shared dimensional structures, and clear ownership for each dataset. We prioritised the highest-value reporting domains first (audience and content performance, subscription and retention signals, distribution/notifications, and commercial/ad performance), then designed pipelines to consolidate these feeds into a common structure.
Given the small team size (one engineer, one data scientist, two analysts), the approach focused on minimizing manual overhead and removing recurring bottlenecks: standardised ingestion patterns, repeatable transformation conventions, automated data-quality checks, and a publishing workflow that allowed analysts to ship new datasets and reports without constantly requiring engineering intervention.
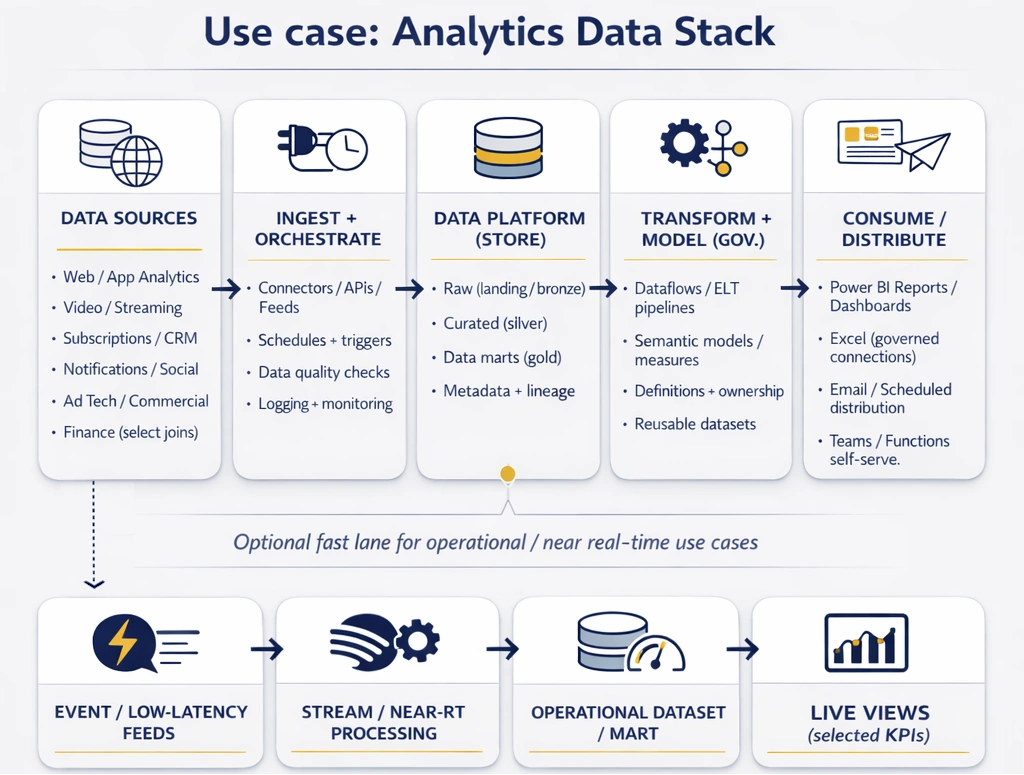
Where the business needed faster decision cycles, we introduced a pragmatic “real-time where it matters” layer rather than forcing everything into low-latency patterns.
Solution
The delivered solution was a modern analytics stack with a layered architecture: ingestion from multiple source systems, a centralized data store for curated datasets, and a governed data mart layer designed explicitly for reporting and self-serve analysis. Transformations were implemented in a structured, maintainable way so that new sources and new reporting requirements could be added quickly without destabilising existing outputs.
On top of the curated layer, we built shared Power BI semantic models and Dataflows to standardise measures and dimensions, enabling multiple reports to reuse the same logic. This also allowed business users to work in Power BI with consistent definitions and—where needed—connect via Excel to the same semantic layer for deeper exploration.
Operationally, the stack included monitoring and refresh orchestration, plus controls to keep reporting stable as source systems changed.
Results
The organisations moved from spreadsheet-based reporting dependency to a scalable reporting and analytics capability with consistent definitions and reusable models. Teams gained a reliable, shared view of performance by combining multiple digital sources into context-rich reporting, reducing the “multiple versions of the truth” problem and improving decision confidence.
Self-serve became viable: users could answer a meaningful share of questions directly in Power BI (or via governed Excel connections) without waiting for bespoke extracts, which reduced bottlenecks on the central team and improved turnaround on new requests. Where near real-time visibility was required, stakeholders received faster operational signals without compromising the integrity of core reporting.
Overall, the solution improved reporting reliability, accelerated iteration, and created a foundation that could grow with additional sources and use cases without a proportional increase in manual effort.
Let's talk
Together we will find the right approach for your needs.